Analytics, rebuilt
"You spent ₹17,041 this cycle" is a fact. "Saturday is your heaviest day — a third of everything" is something you can actually do something about. Analytics has been rebuilt around the second kind.
Buckets, at a glance
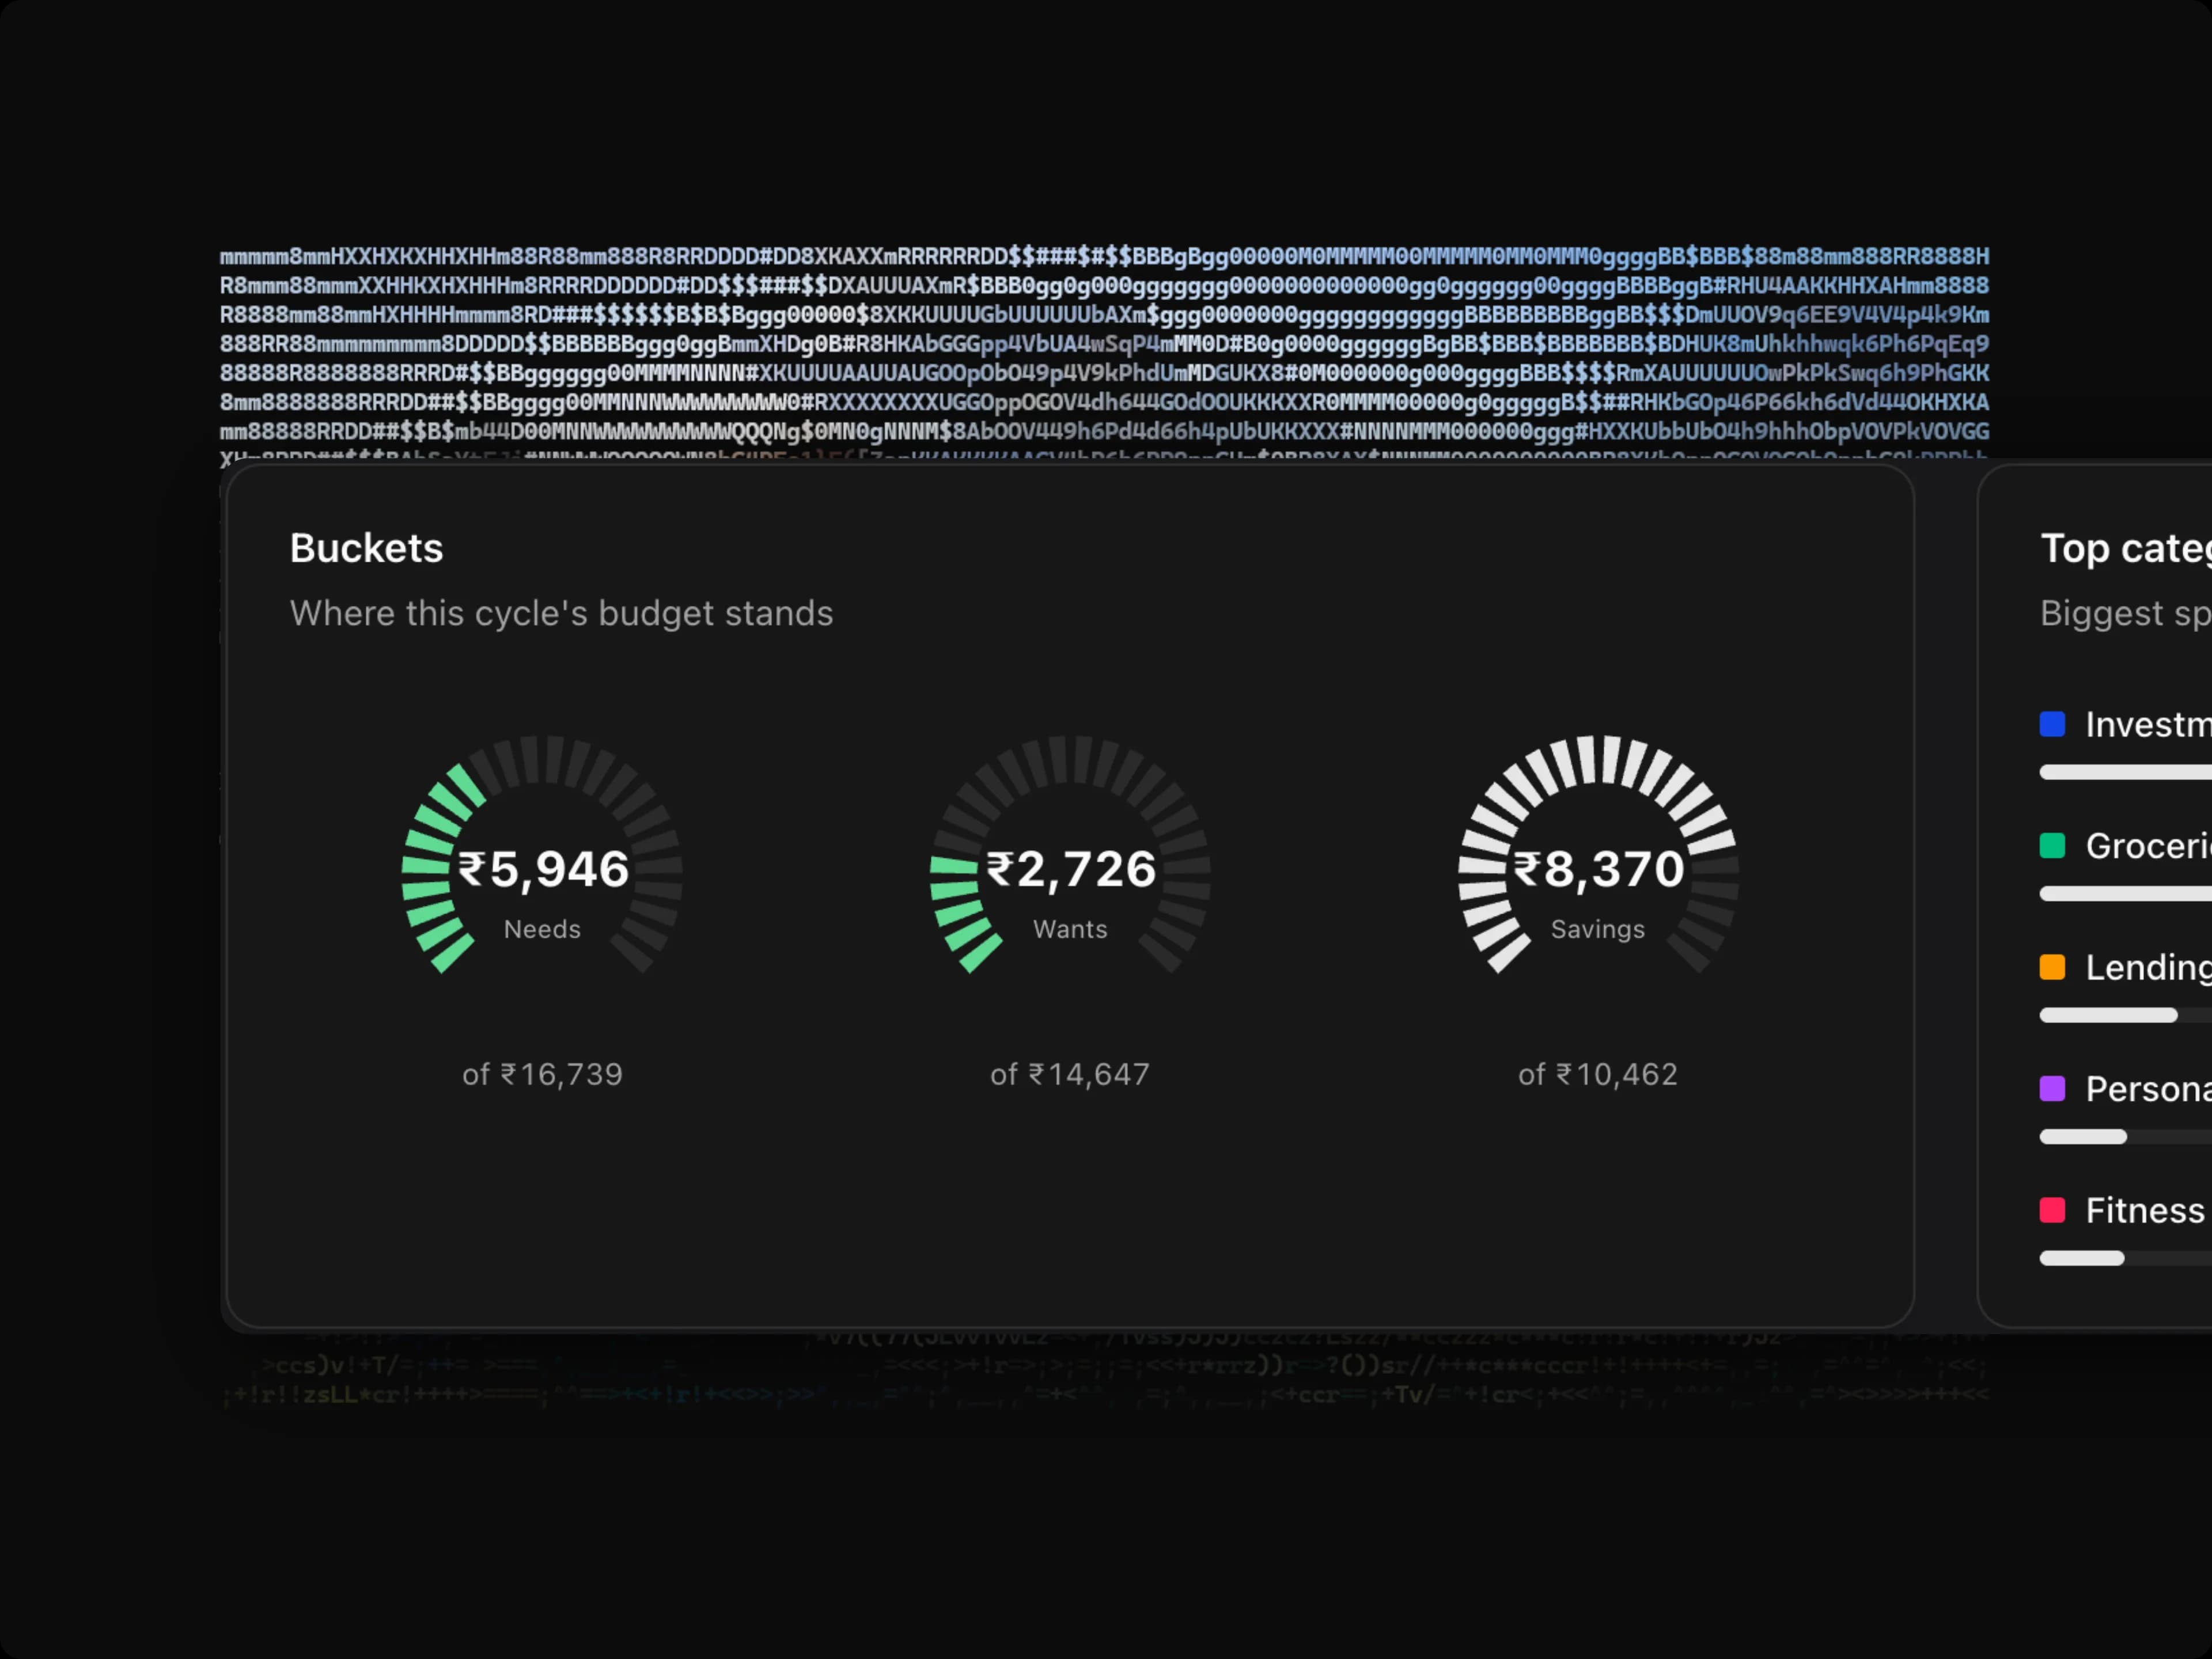
Needs, Wants and Savings as gauges. You can see how much of the cycle you've used before you've read anything — the number underneath is confirmation, not the point.
Where the money went
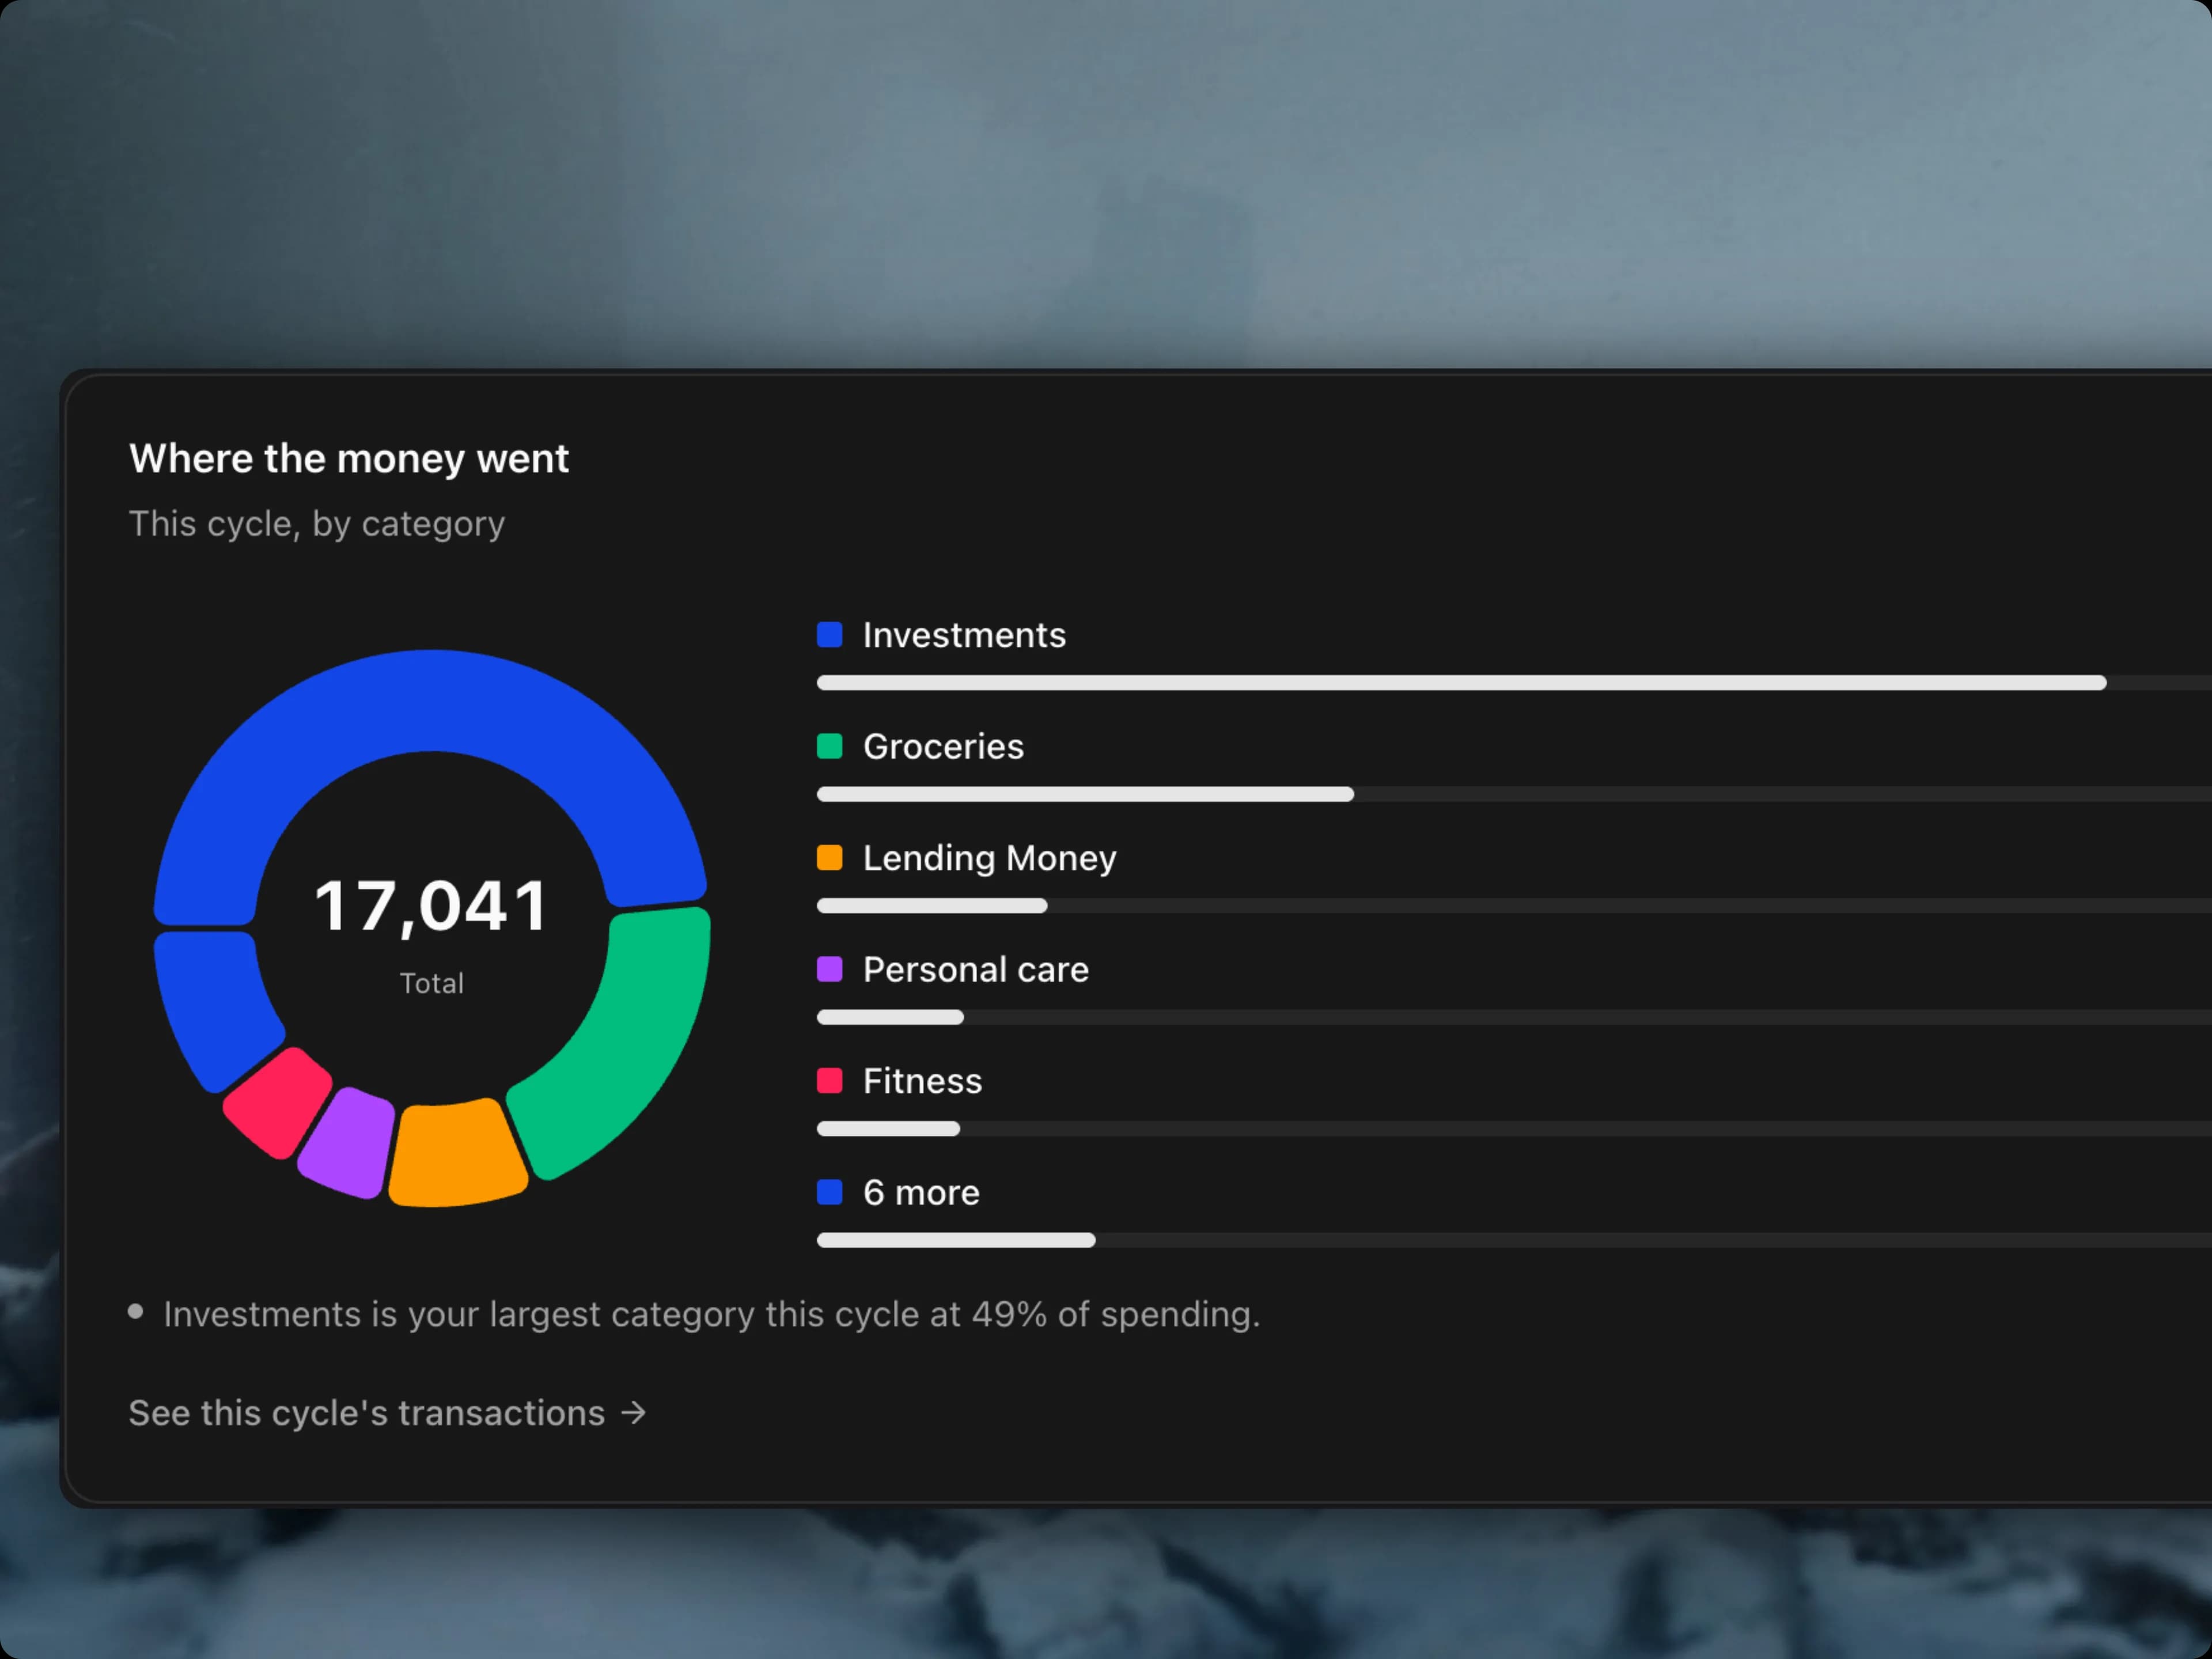
Your cycle broken down by category, largest first — and the headline called out in a sentence, because the whole reason you opened the chart was to find out which one it was.
Income vs spending
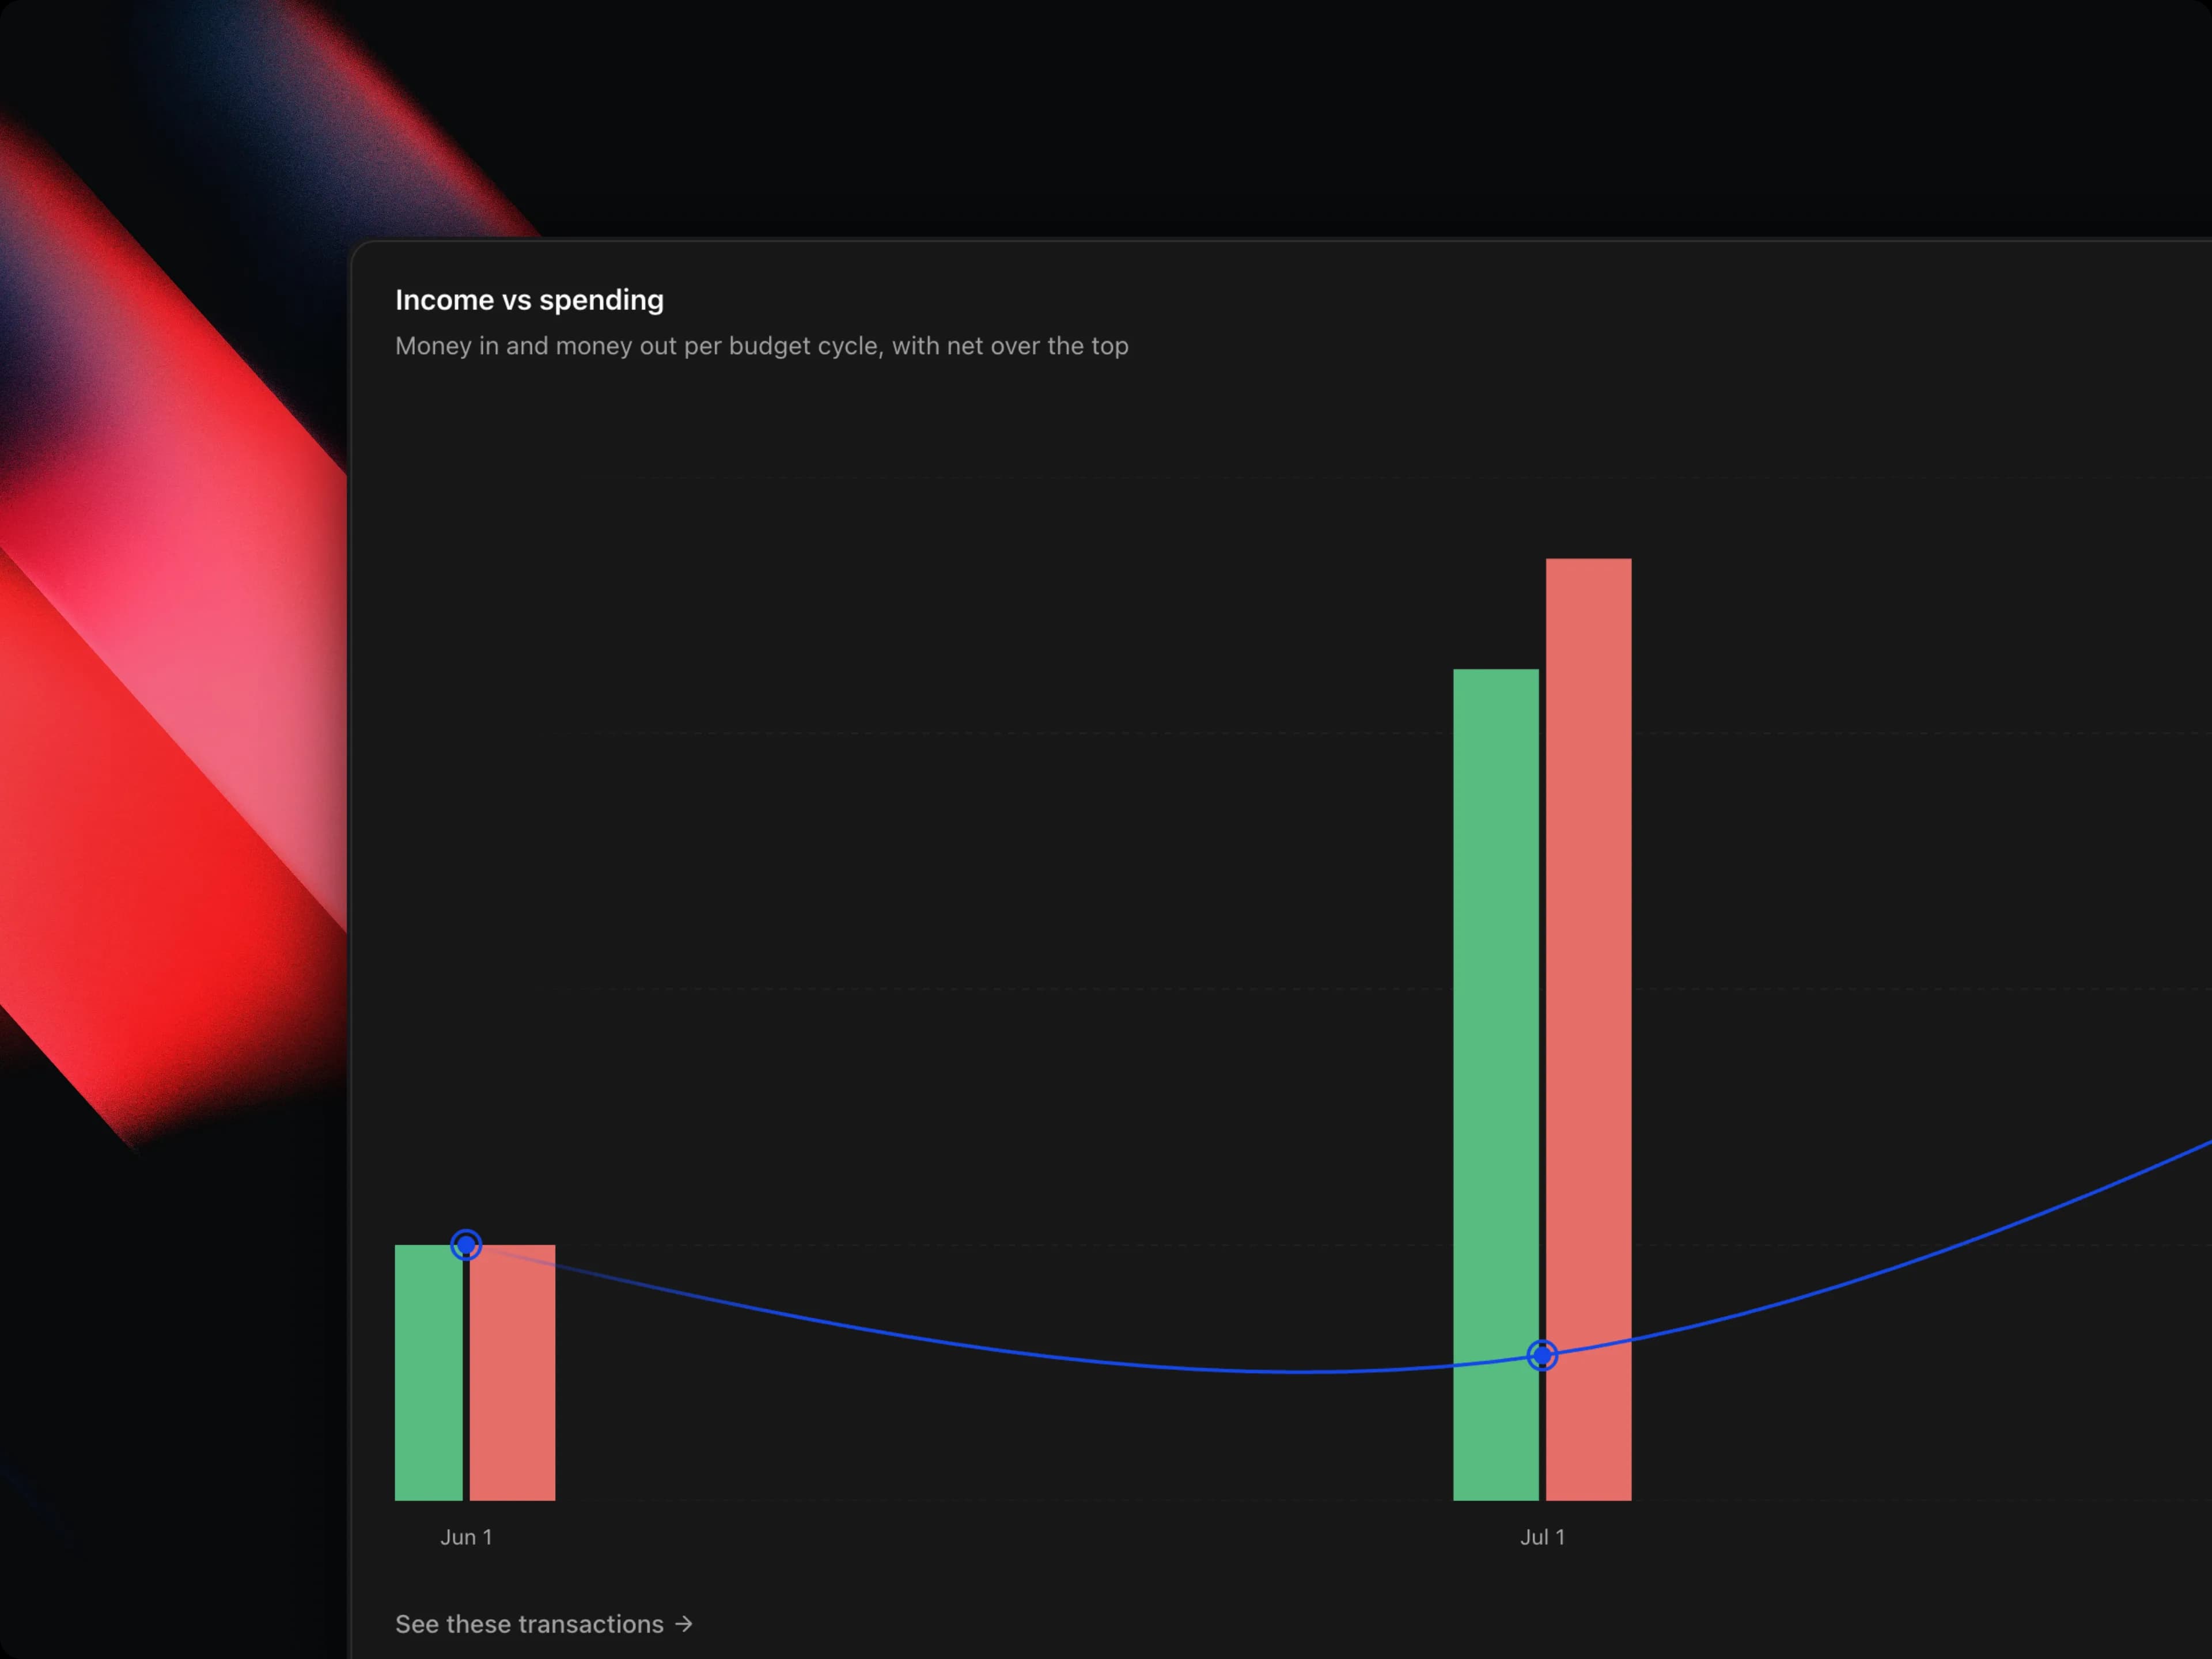
Money in against money out, cycle by cycle. The line over the top is the net — the shape of it tells you whether the gap is widening or closing.
Spending by day of the week
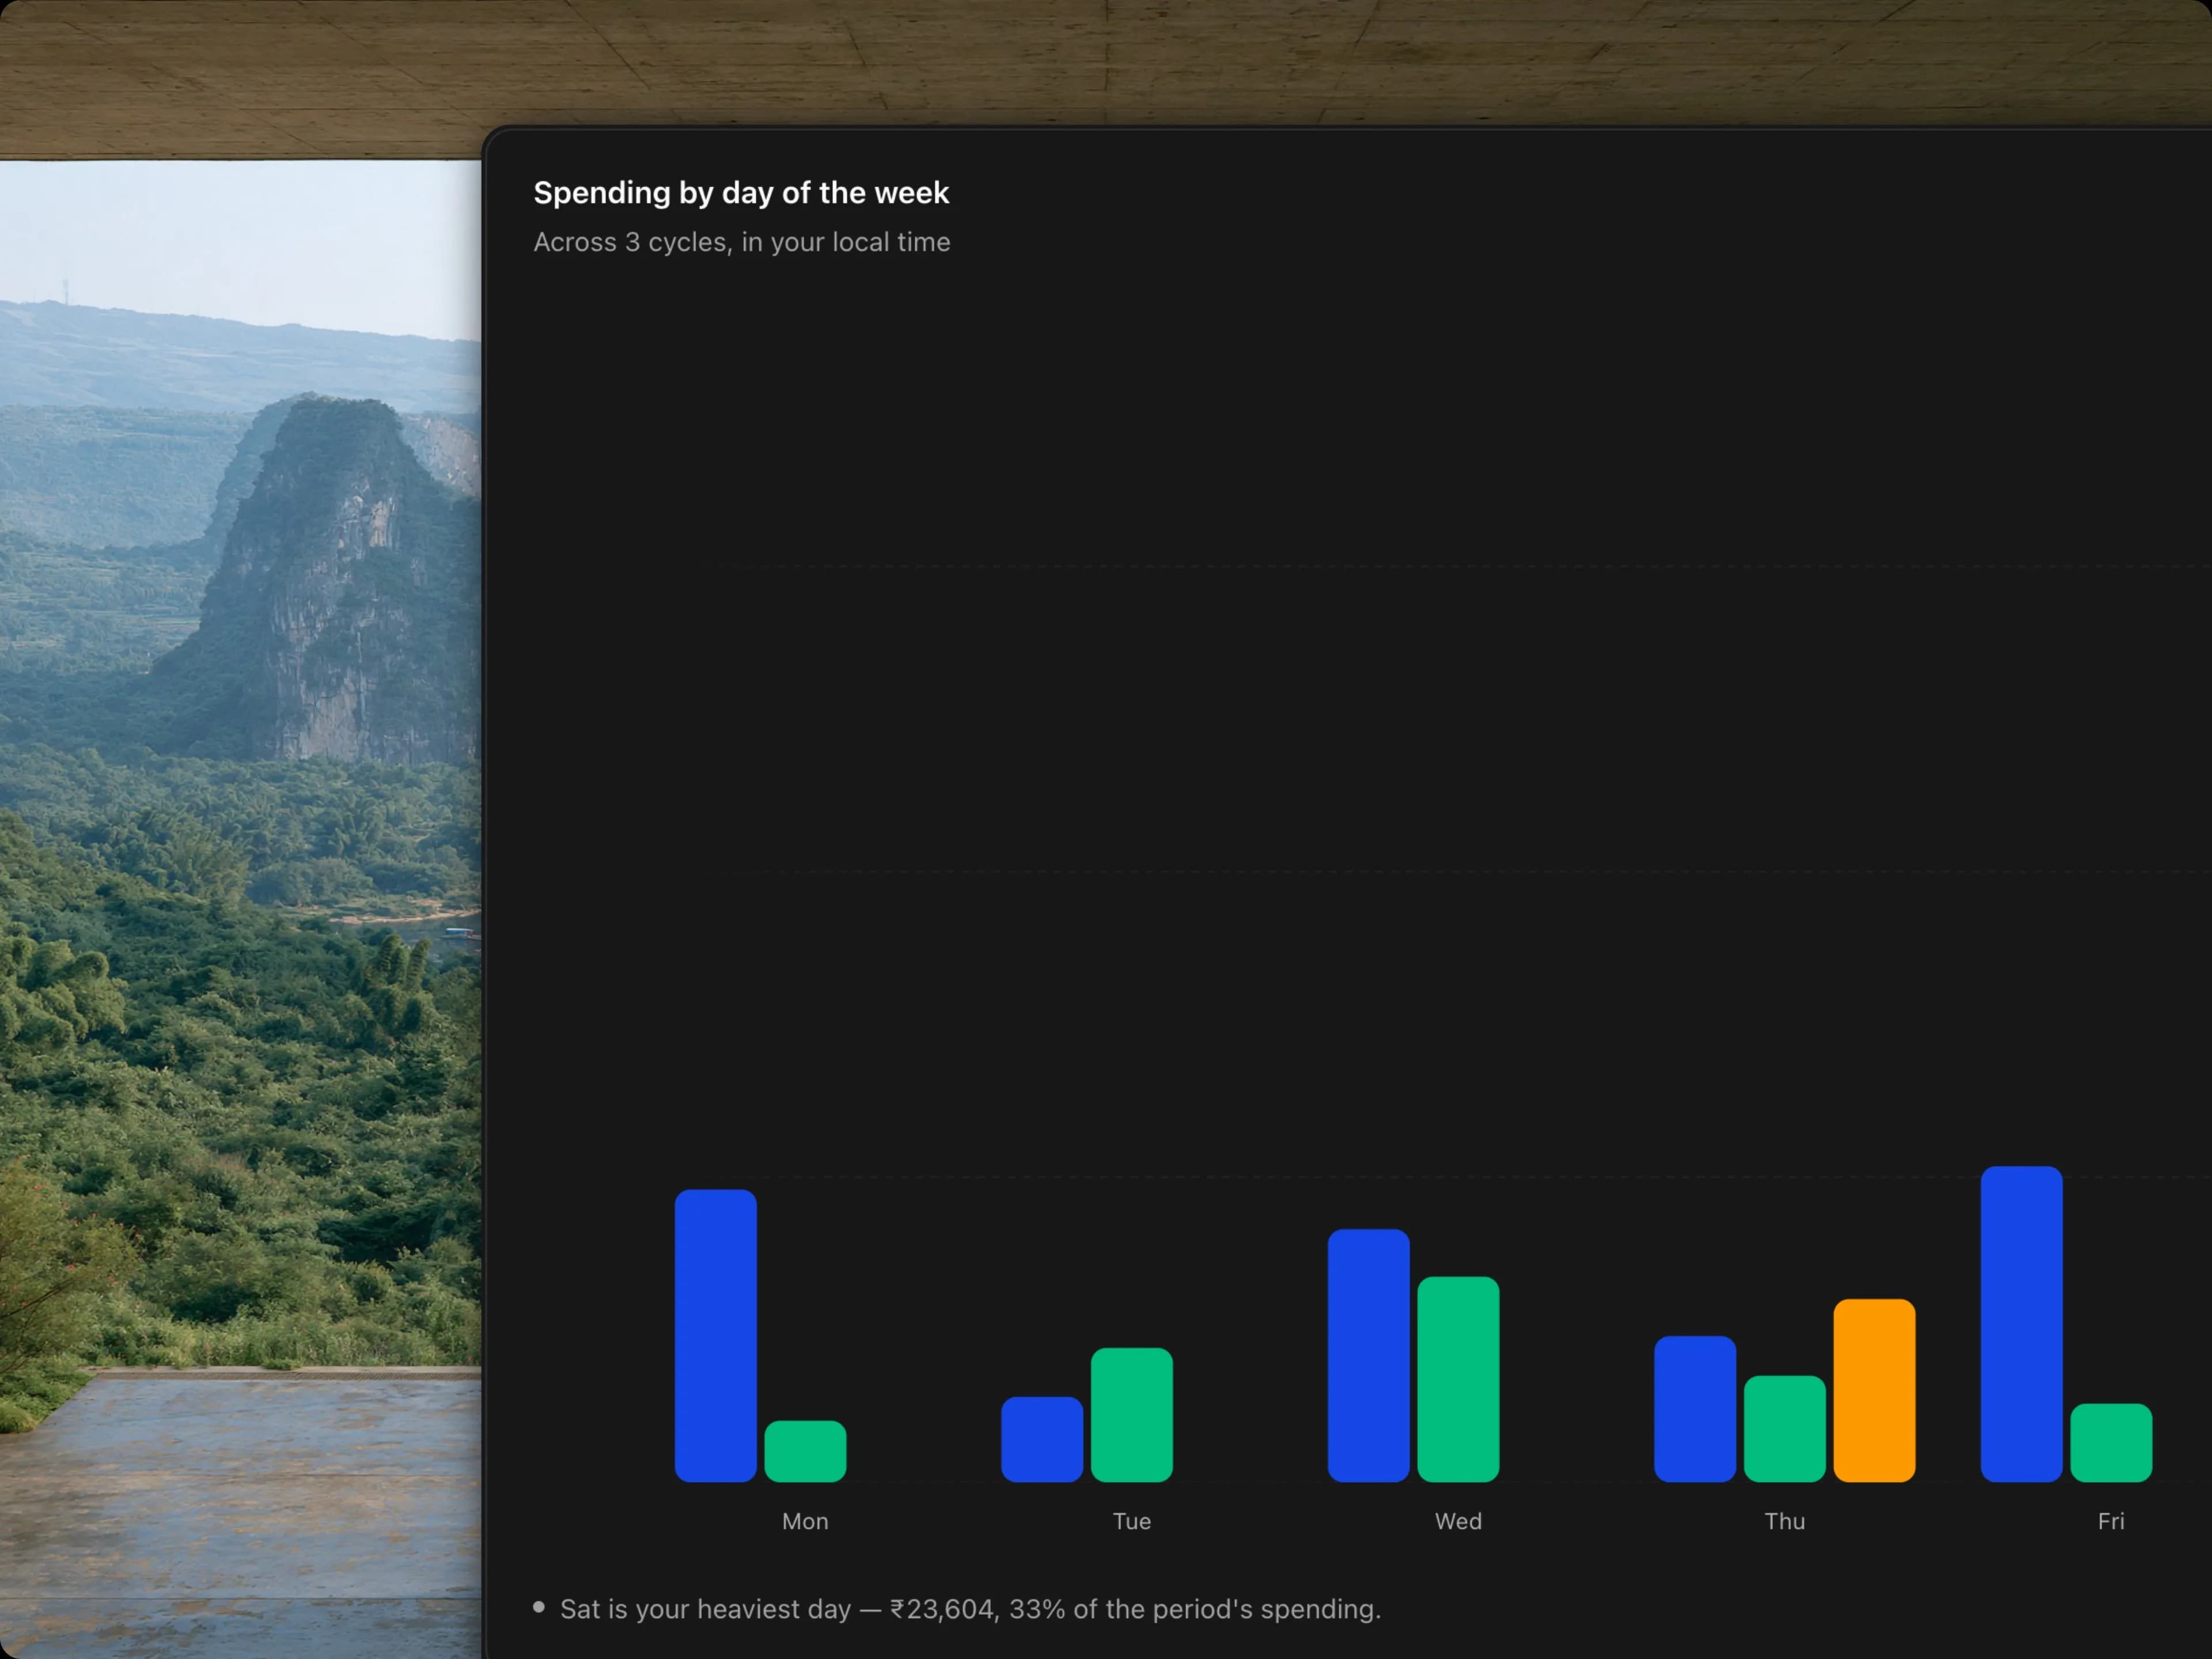
Habits show up here that a monthly total hides completely. Spread across several cycles, one heavy day is a coincidence; the same heavy day every week is a habit.
Also
- Charts respect your reduced-motion setting — no animation if your system asks for none.
- Cycle labels use your timezone, so a cycle that starts on the 1st no longer reads as the 31st.
- Analytics is now a tabbed surface, and the charts are lighter and quicker to draw.
Fixed
- Wrapped now appears only in the last few days of the month, worked out in your own timezone — and stays away entirely when the month has nothing worth looking back on.